Opti' transforms your Kobo data into analysis tables and narrative reports · directly in Excel, powered by AI.


We feel so much better now, deadlines are met and our analyses are much more relevant.
It used to take us forever with pivot tables that were sometimes even wrong. With Opti' it's done quickly and it's reliable, well done.
It's simply a must-have for a professional like me.
Demo
From raw database to final report · in just a few minutes.
An AI chatbot integrated directly into Excel. Ask a question, launch a full analysis or request MEAL advice · in natural language.
OptiBot understands your request, selects the relevant columns and automatically generates tables + interpretations.
Ask specific questions about your database. OptiBot explores the data and answers with figures.
OptiBot is also a methodological assistant. Ask for advice on survey design, XLSForm code, indicators or MEAL best practices.
Before / After
⏱ 2 to 3 days
⏱ 20 minutes
Artificial Intelligence
Opti' analyzes each table and automatically writes interpretations · directly in Excel, no additional tools needed.
Click Clean Data: the AI identifies columns with manually entered responses (e.g. "Other, Specify") and automatically standardizes the values to make them usable.
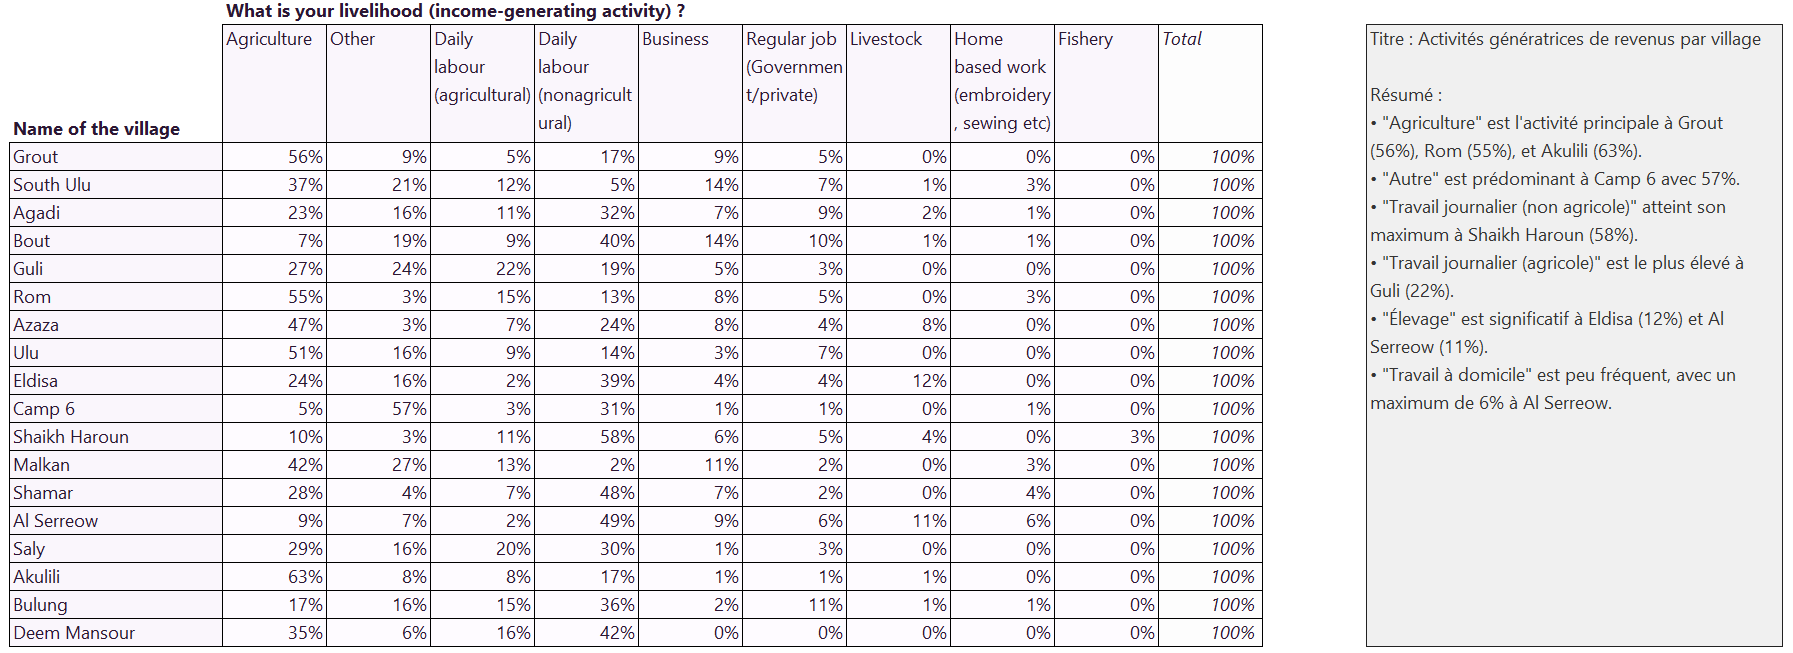
Short and impactful summaries for each generated table.
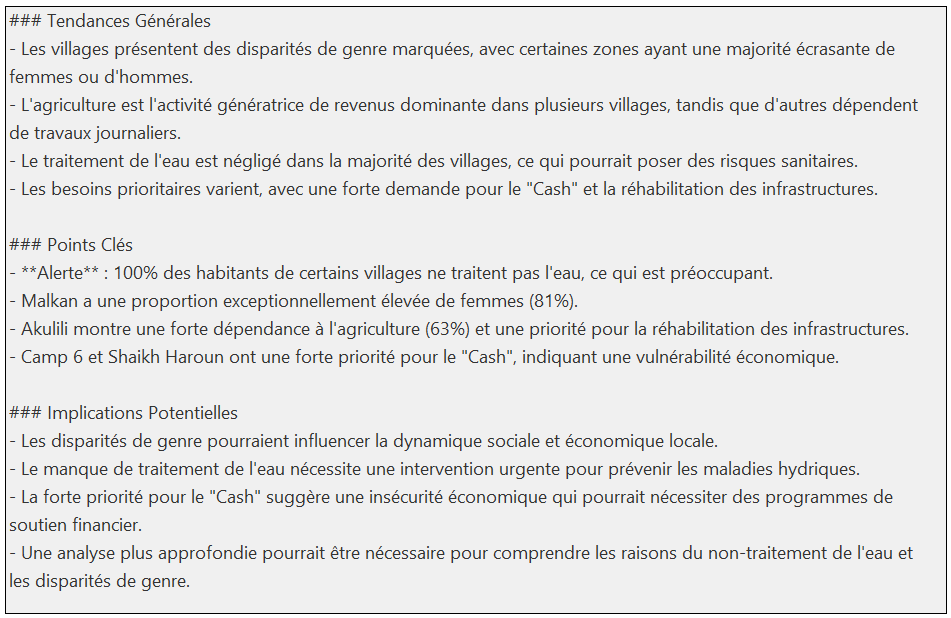
Highlights red flags and key information.
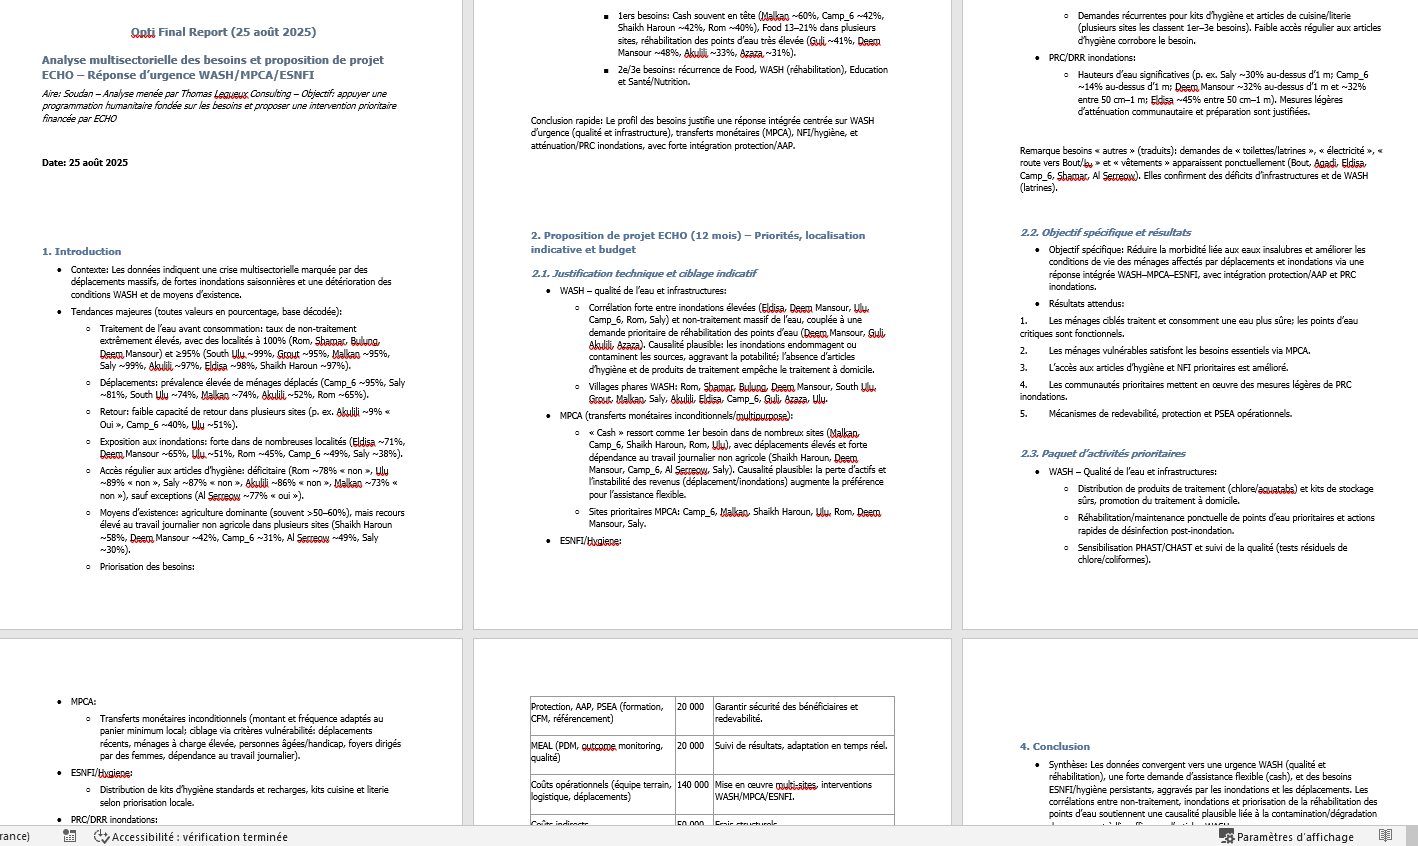
Structured Word file · detailed analysis, protection & accountability alerts, conclusion.
Analysis Engines
Switch engines at any time, depending on your data protection and analysis power requirements.
Maximum GPT power for complex analyses and detailed reports.
The AI runs entirely on your machine. No network connection required, your data stays with you.
Analysis Modes
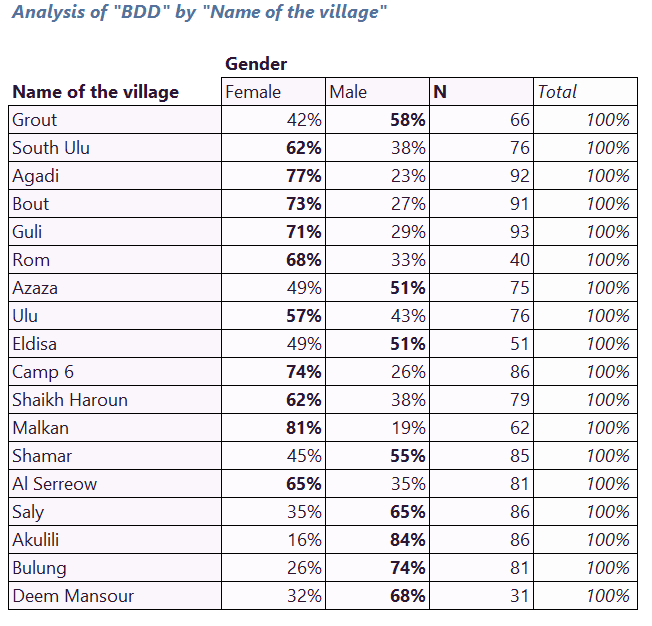
Each mode supports disaggregation up to 2 levels (e.g., by village and by gender).
Distribution of unique values by frequency and percentage. For a quick and clear overview of your qualitative data.
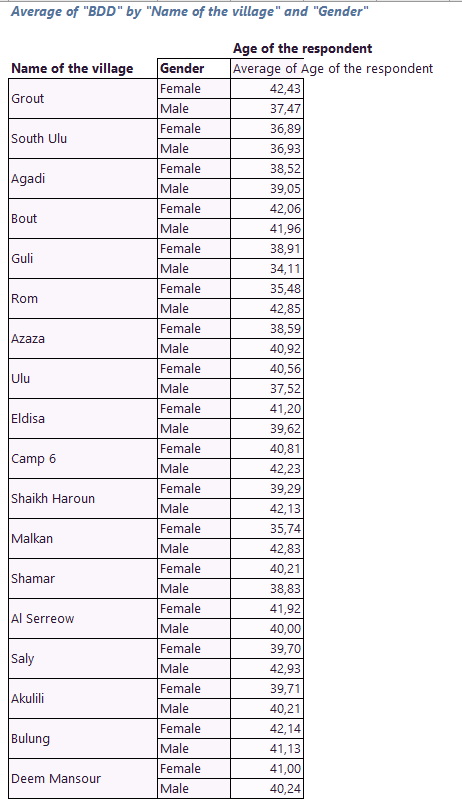
Calculates conditional averages based on your reference columns. Ideal for numerical data and scores.
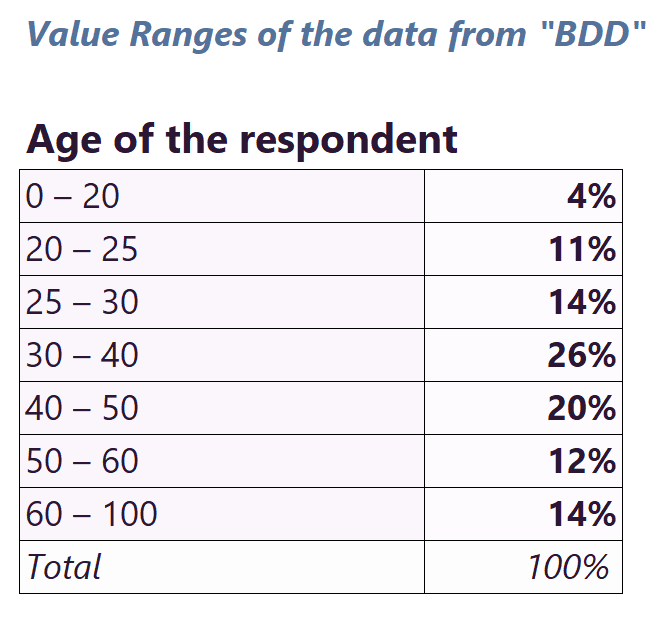
Groups decimal values into ranges to transform continuous data into usable categories.
Tutorial
Follow a complete analysis step by step with Opti'.
Opti' doesn't change your tools · it strengthens what you already have.
Your data never leaves Excel. Offline AI option for maximum confidentiality of beneficiary data.
GDPR compliant. OptiBot checks headers and asks for permission before viewing any sensitive column.
€999/year vs 3 days of analysis saved every week. ChatGPT Pro without framework: €2,880/year.
Works in Excel · no new software, no training. Get started in minutes.
Pricing
The Demo version is free with no commitment — try it with your real data.
Free
~15 full analyses to discover the tool + monthly refills
€99 /month · or €950/year -20%
~200 analyses per month · for active MEAL teams
Free, no commitment, directly in Excel. 100% compatible with KoboToolbox.
Install for free