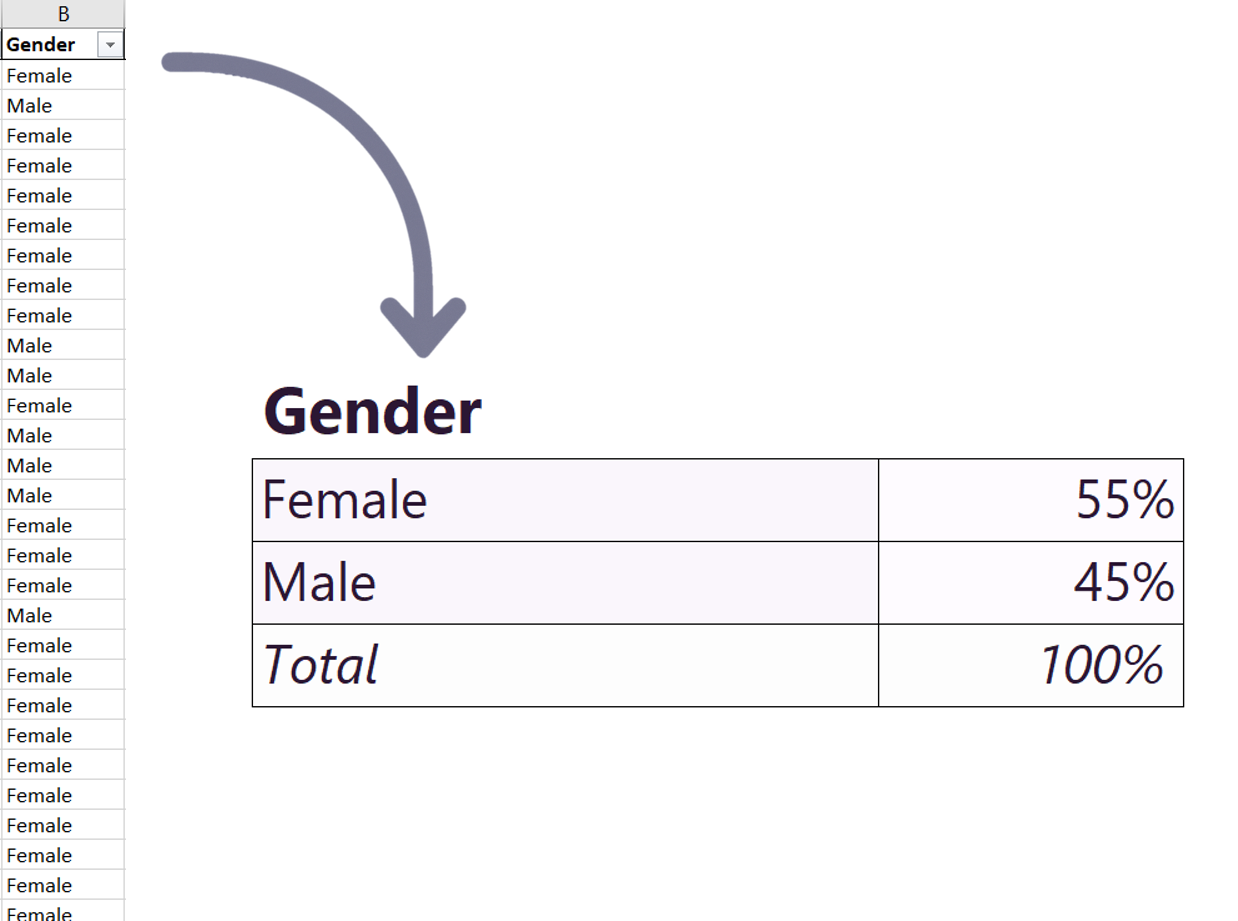
Opti’ is an Excel add-in that turns your datasets into clear, reliable analyses in just a few clicks. Designed for humanitarian, development and research work, it automates your tables and generates insightful reports with AI — directly inside Excel.

GET IT FOR FREE

Subscriptions

By creating an account, you get the Demo subscription, free and without commitment.

Demo

14 days · Free
Token limit for 14 days: 30,000
✅ Excel table generation — Unlimited
✅ Table analysis — gpt4
✅ Summary writing — gpt4
✅ Final narrative report — GPT-5
✅ Multilingual (120+ languages)
❌ Multi-user account
❌ Your own API key

Essential

Monthly · 19€ Annual · 198€
Token limit / month: 200,000
✅ Excel table generation — Unlimited
✅ Table analysis — gpt4
✅ Summary writing — gpt4
❌ Final narrative report— GPT-5
✅ Multilingual (120+ languages)
❌ Multi-user account
❌ Your own API Key

Pro

Monthly · 49€ Annual · 535€
Token limit / month: 400,000
✅ Excel table generation — Unlimited
✅ Table analysis — gpt4
✅ Summary writing — gpt4
✅ Final narrative report — GPT-5
✅ Multilingual (120+ languages)
❌ Multi-user account
❌ Your own API Key

Infinity

Annual · 999€ + OpenAI fees
Token limit / month: Unlimited
✅ Excel table generation — Unlimited
✅ Table analysis — gpt4
✅ Summary writing — gpt4
✅ Final narrative report — GPT-5
✅ Multilingual (120+ languages)
✅ Multi-user account
✅ Your own API Key

To subscribe to a plan, log in to Opti’ in Excel and click Upgrade.

About

What is Opti’?

An Excel add-in designed for humanitarian, development, and field research workflows. It transforms raw data into clean analysis tables and clear AI-assisted reports — all within Excel.

AI-Assisted Interpretation

Transform raw tables into clear narratives, ready for decision-making. Opti’ analyzes each table in depth — directly in Excel, no extra tool required.
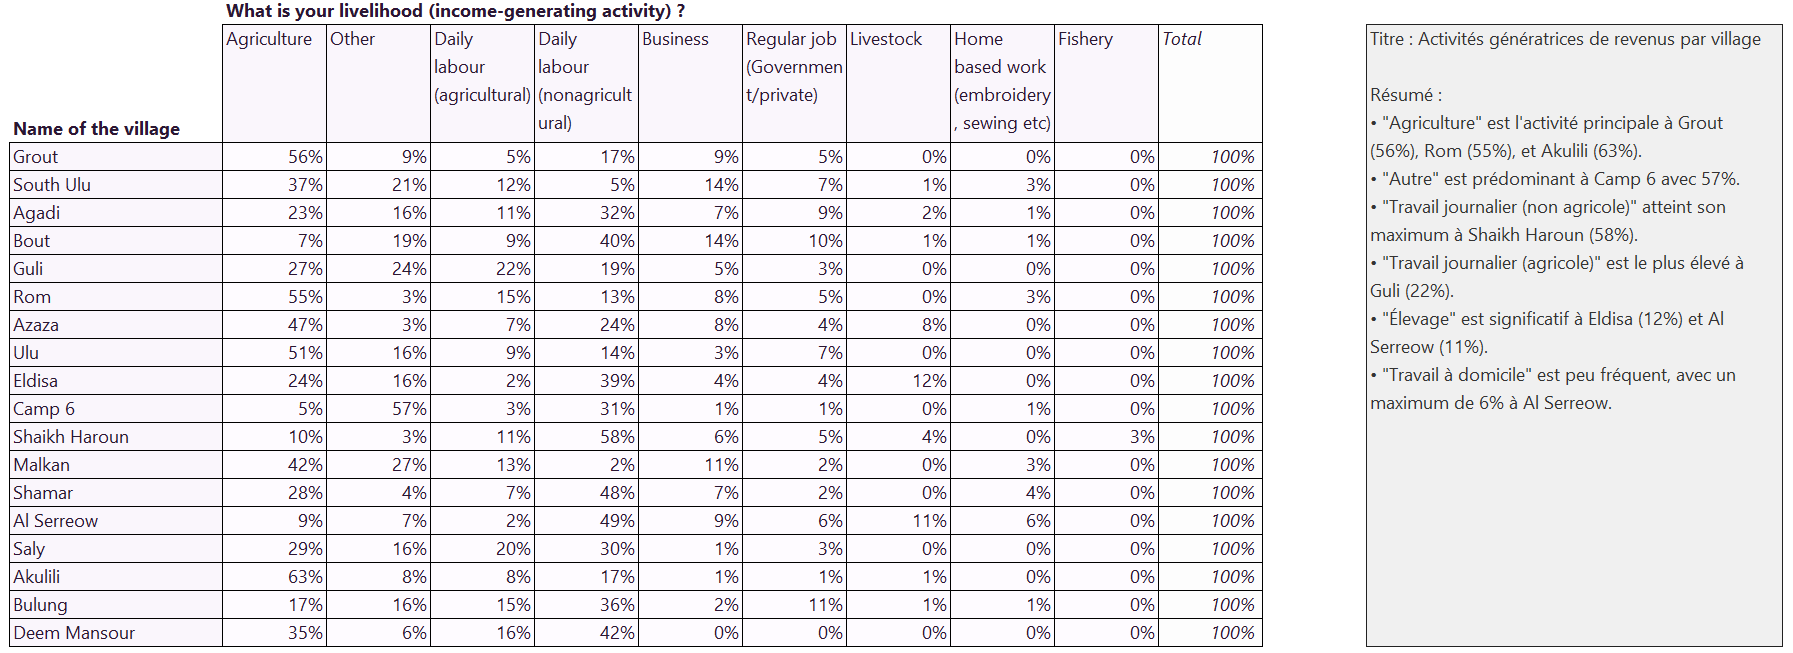
Table-by-table analysis
Table-by-table analysis illustration

Short and impactful summaries for each generated table.
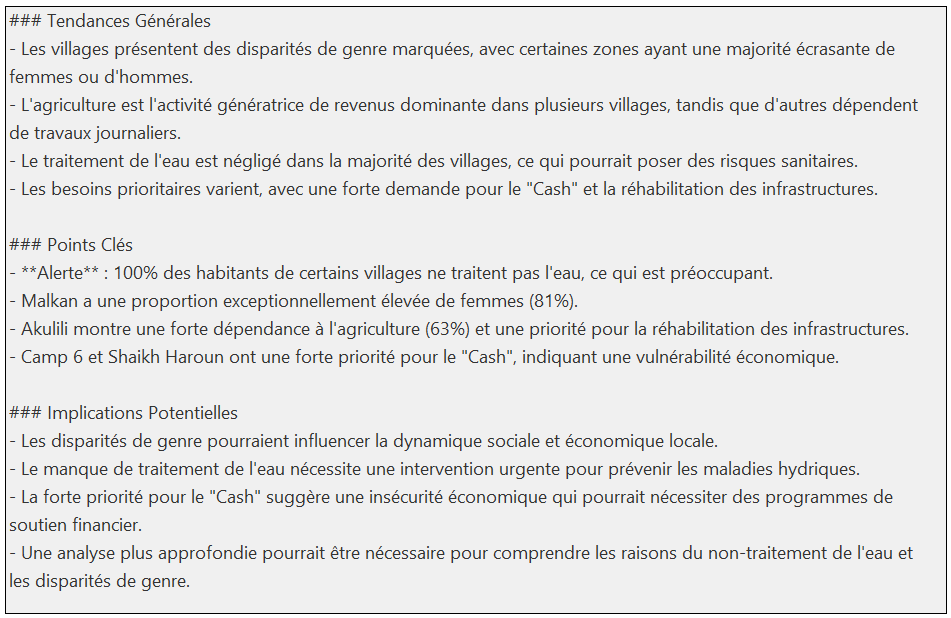
Synthesis by series of analyses
Synthesis of analyses illustration

Highlights red flags and key insights.
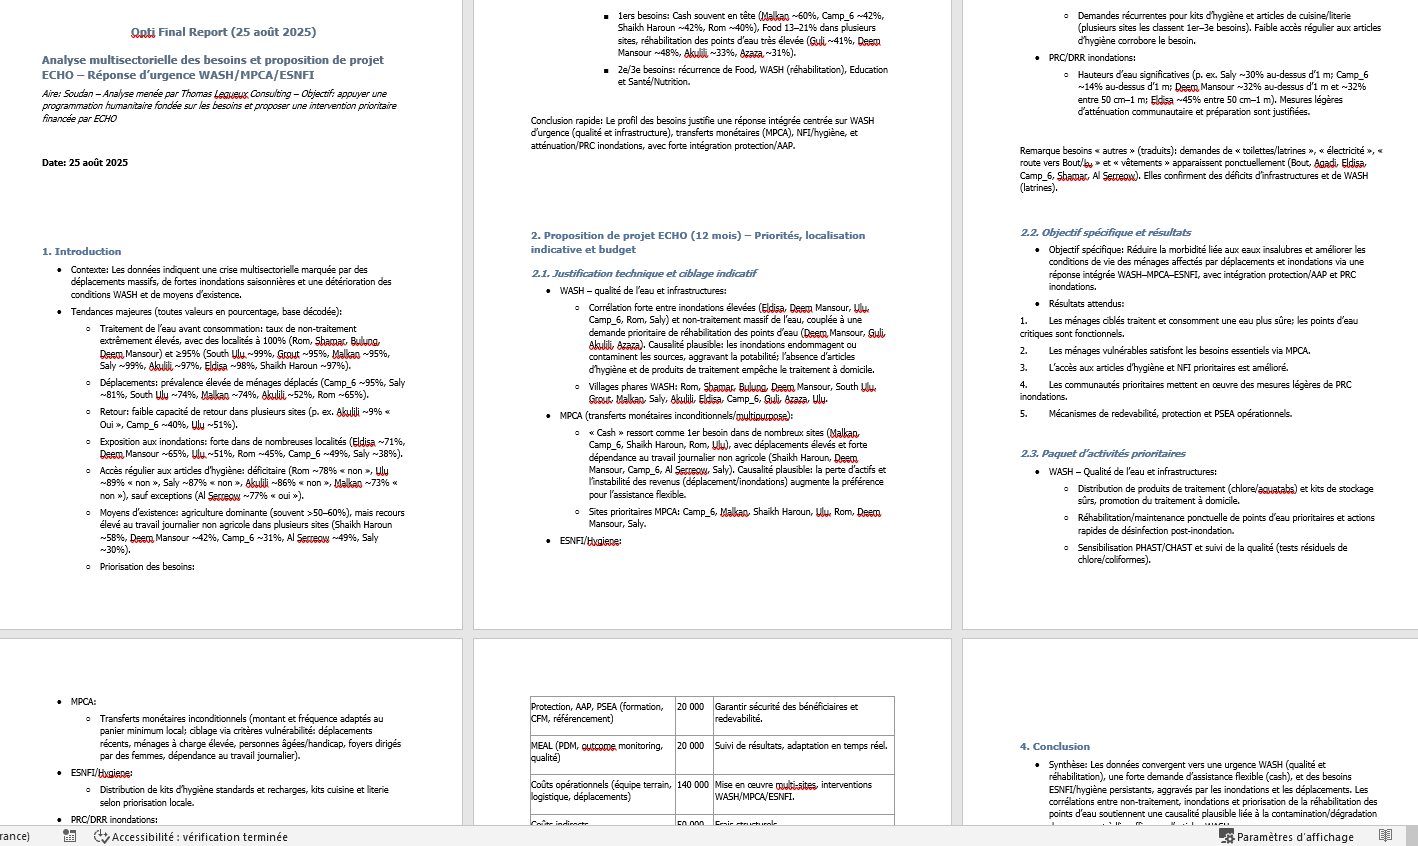
Final Narrative Report
Final narrative report illustration

A report written as a Word document. Structured, with detailed analysis based on your guidance, including protection & accountability alerts, and a conclusion.

  • Multilingual by design — over 120 languages understood and generated.
  • Designed for field realities — humanitarian, development, and research use cases.
  • From data to meaning — highlights trends, correlations, and recommended actions.
  • No code — works through an intuitive interface.

The Pro & Infinity plans include the final narrative report for complete, publication-ready deliverables.

What You Can Do

  • Generate Excel tables with formulas — robust, transparent, and reusable.
  • Run multiple analyses at once by selecting modes and columns from a ready-to-use list.
  • Get AI-generated summaries for each table and a synthesis adapted to each analysis series.
  • Produce a final narrative report with key information, trends, and key takeaways.

Analysis Modes

Simple

Simple mode illustration

Distribution of unique values in percentage by column. For a quick and clear overview.

Simple-multi
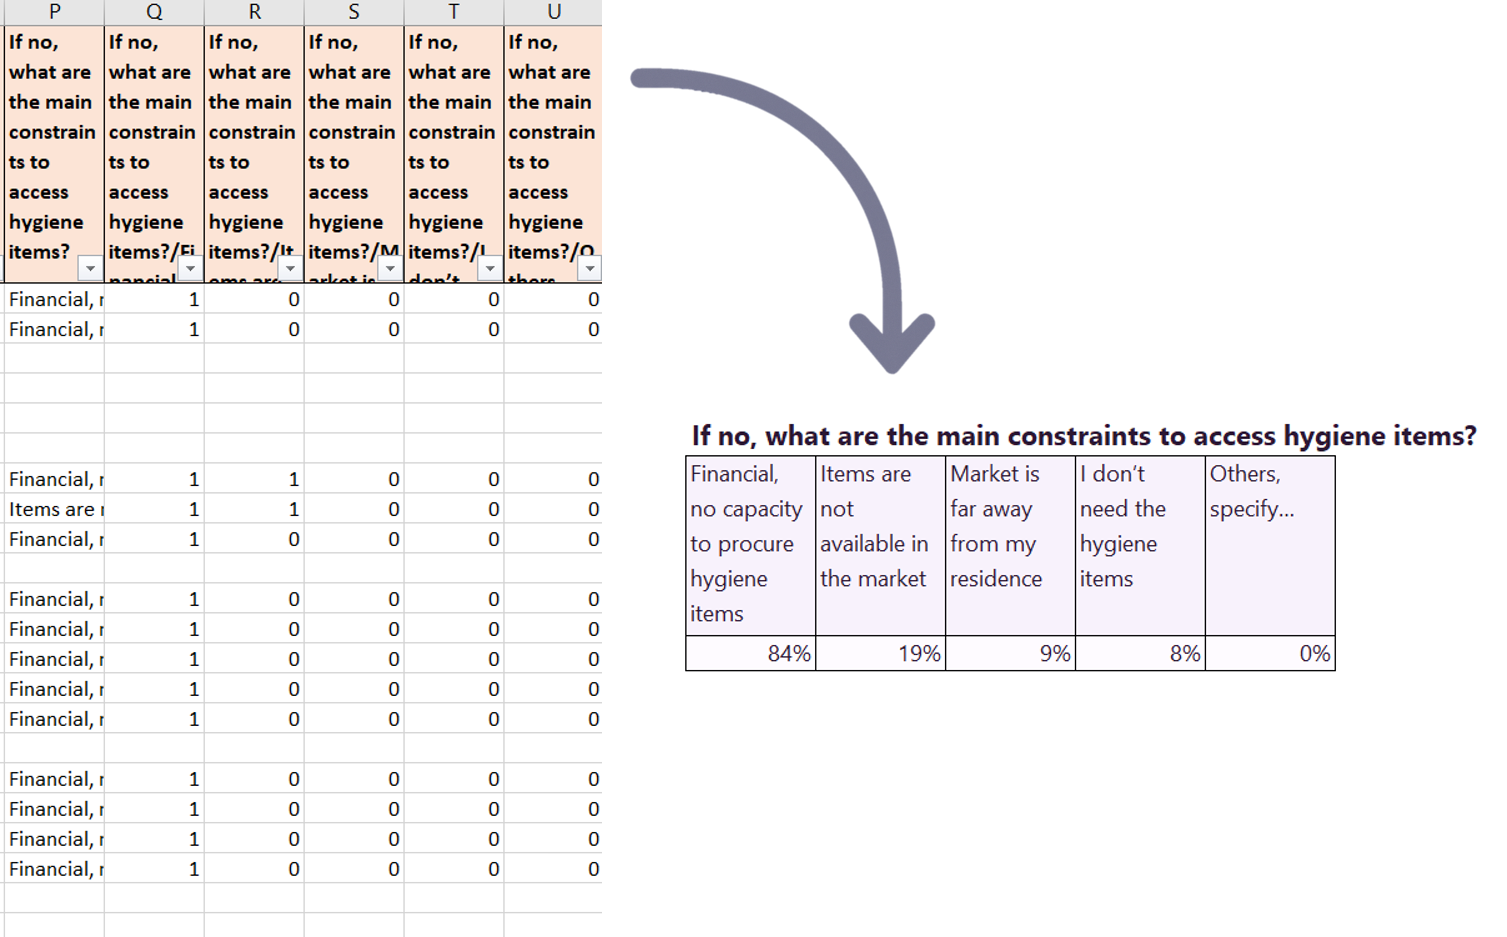
Simple-multi mode illustration

Designed for multiple-choice questions (Kobo/ODK groups). Generates percentages of unique values.

Crossed
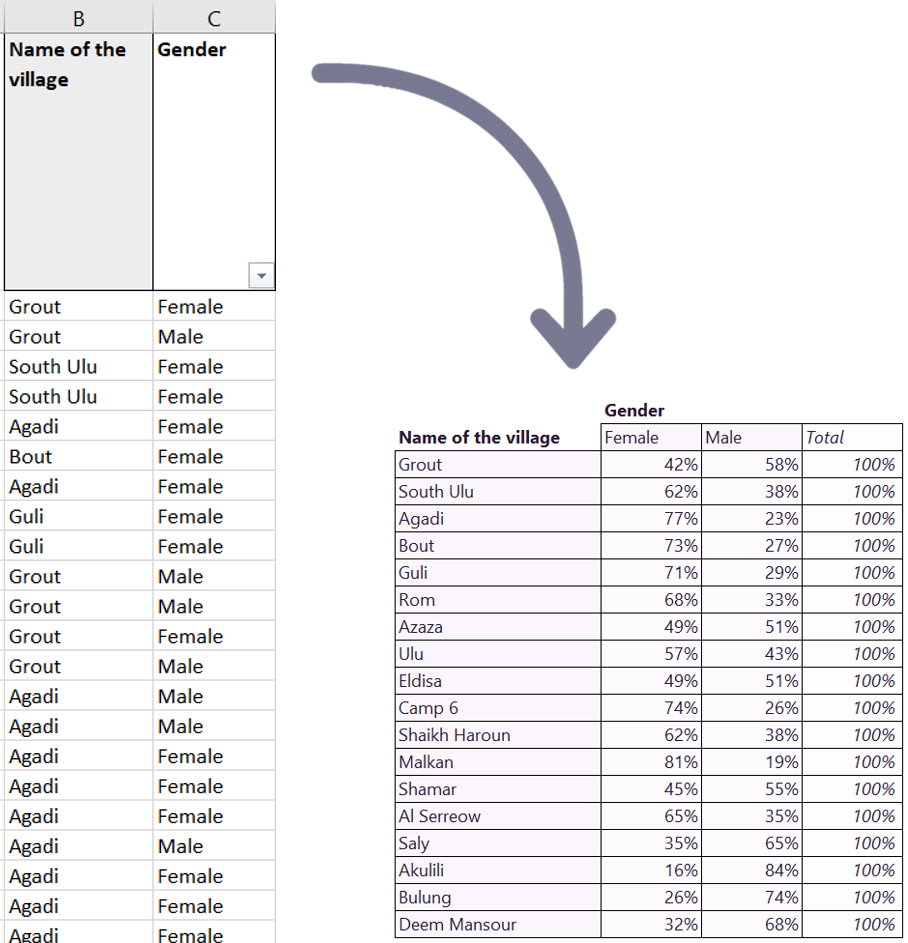
Crossed mode illustration

Disaggregates variables based on a reference column.

Crossed-multi
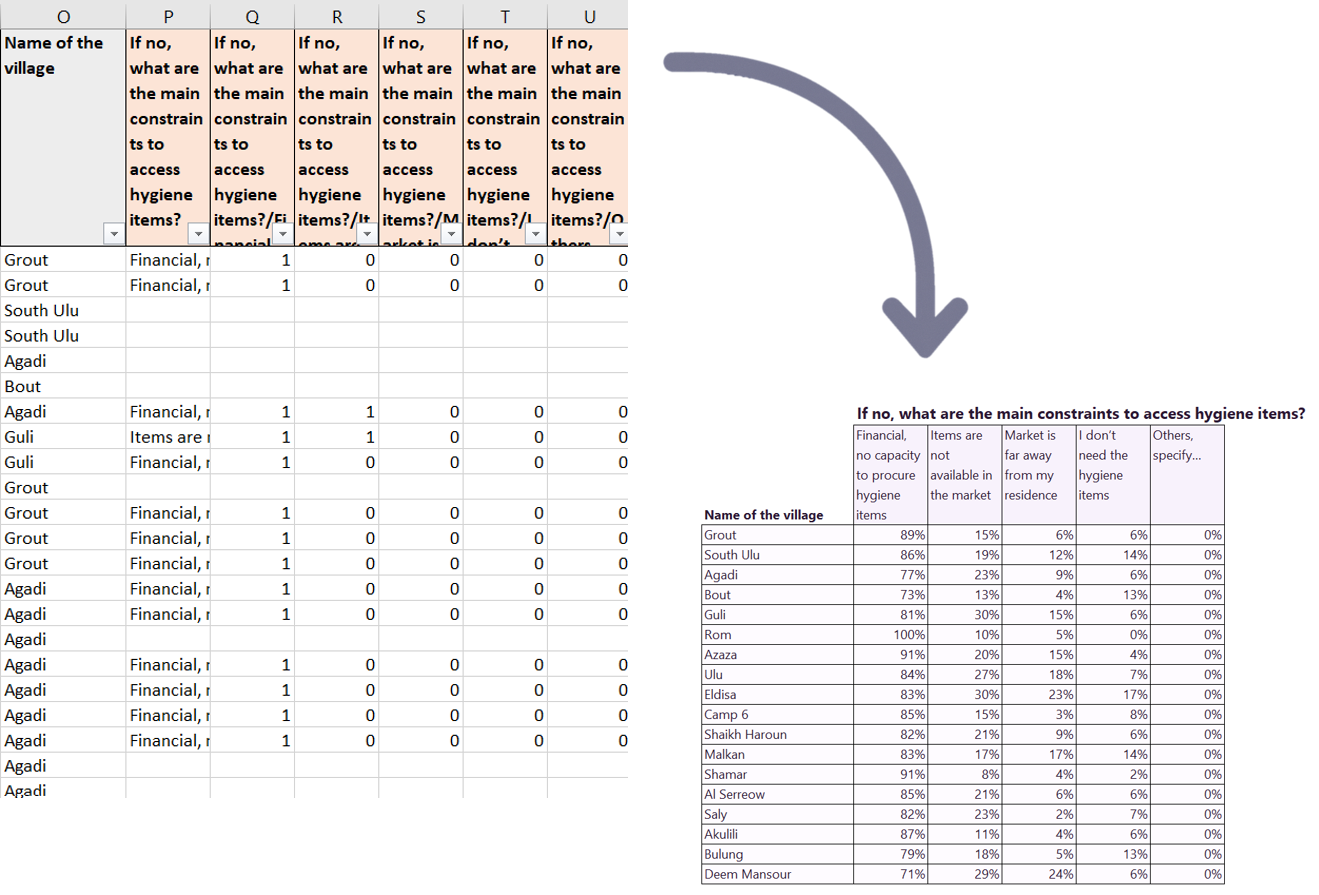
Crossed-multi mode illustration

Disaggregates multiple-choice questions based on a reference column.

How It Works (3 Steps)

  1. Open your Kobo/ODK (or other) database in Excel.
  2. Provide context and some guidance.
  3. Select the columns — and start the analysis.

Then automatically generate tables + summaries + synthesis + final report.

Who Is It For?

MEAL officers, M&E consultants, data analysts, project coordinators, database managers, local & international NGOs, UN agencies, and research institutes — anyone using KoboToolbox, ODK, XLSForm, or Google Sheets.

Why It Matters

Save time — hours saved every week on recurring analysis and formatting.
Better reports — clear tables, focused narratives, and actionable insights.
Programmatic impact — strengthened monitoring, more accountability, and better decision-making.